Predicting the End of the Bear Market in 2023
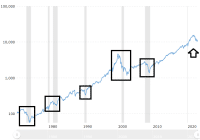
This is a chart of Nasdaq that goes back fifty years, to 1972. I have highlighted five historical corrections of 10% or more. First, the bad news. They all lasted longer than one year, from peak to trough with one exception. November 1972 (Index was 133) to September 1974 (63). One year, 10 months, and a decline of… Read More »


